Give the time history several records
A fragility curve needs several records that collapse. Import a folder of records (Assign › Ground Motion › Import record suite folder…), or generate them: in Generate ground motion…, set Number of records above 1. Each record gets the next random seed, so all of them match the same spectrum.
Add the IDA study
Choose Analysis › Incremental dynamic analysis (IDA). If the project has no IDA study, one is added as a copy of the time history, with the same records, hazard and loads. The Output panel tells you to check its options in Properties.
The new study runs every record at the scale factors 0.25, 0.5, 0.75, 1, 1.5, 2 and 3. With more than one record, Every record is on.
Choose the intensity levels
In the time history group, under Incremental dynamic analysis, Intensity levels has two choices:
- Scale factors: every record times the same factors.
- Sa(T1) of each record: each record is scaled so its 5 % spectral acceleration at T1 equals each level. Records are then compared at equal intensity.
For Sa(T1), enter T1 for the scaling (s). With 0, the program uses the ASCE 7 approximate period of a concrete frame of the model’s height. The Record spectrum chart of a time history shows the frame’s own period: enter it here for exact scaling.
Choose the section model
Section model is set per study. Lumped hinges (IMK springs) deteriorate in strength and stiffness with each cycle, and are the usual choice for collapse and IDA. Fibre sections are the default. See Section models.
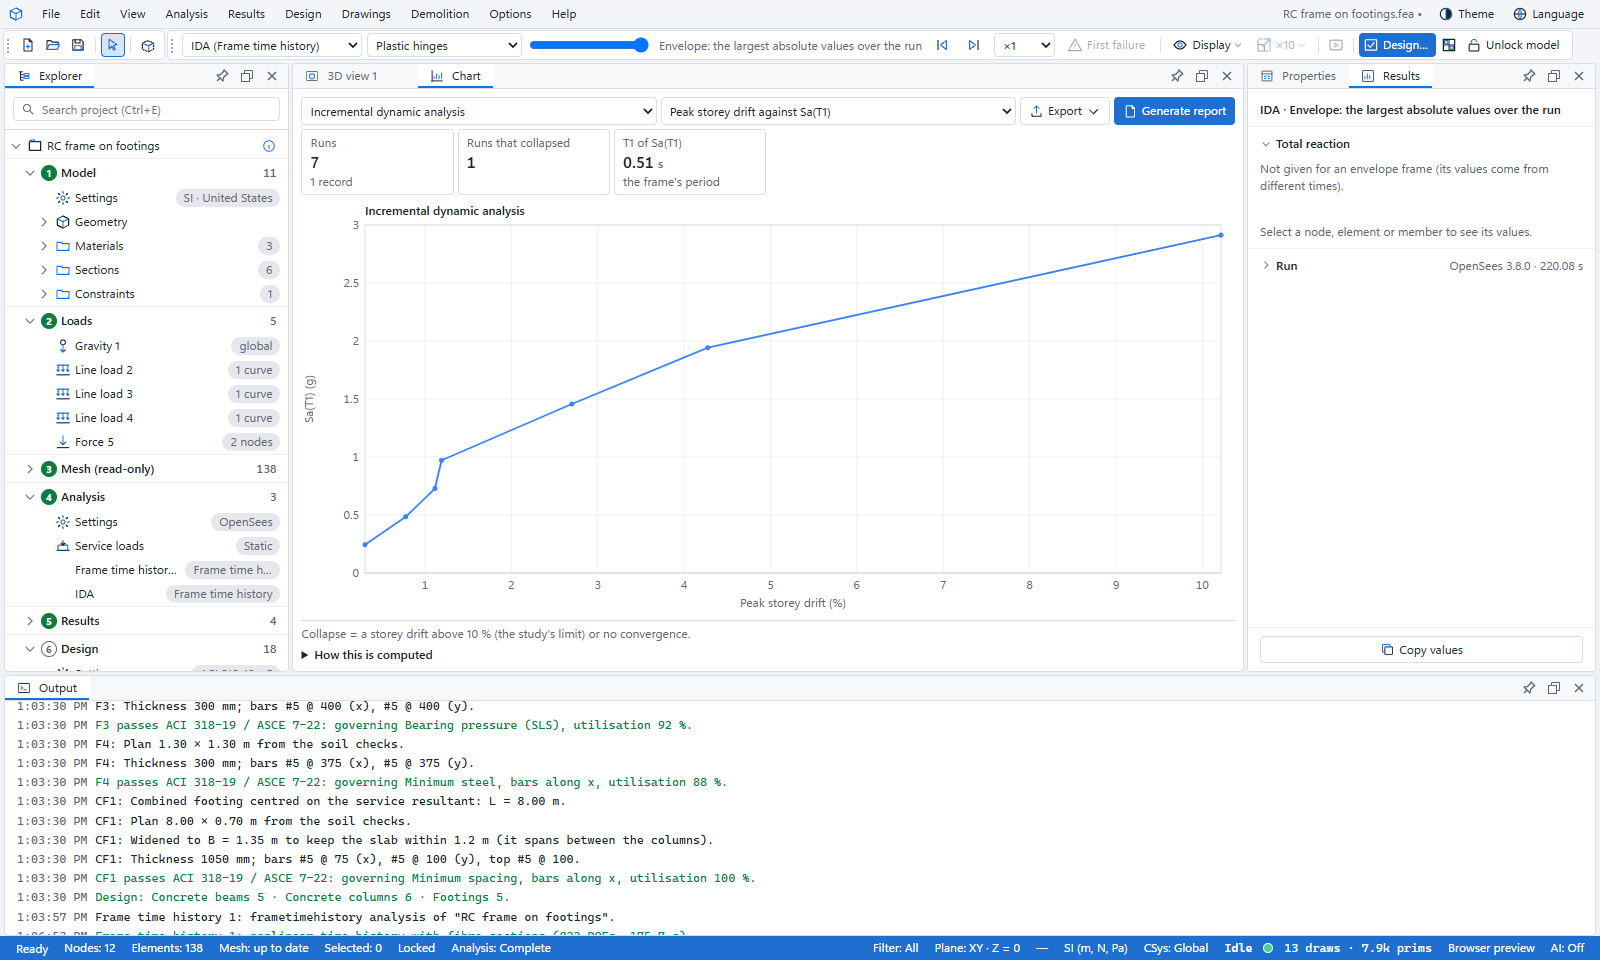
A run counts as a collapse when a storey drift passes Collapse drift (%) (default 10 %) or the analysis stops converging.
Run the IDA
Press F5 with the IDA study selected. Several runs go at once, one OpenSees process per two logical cores. The run nearest the study’s own scale factor is kept as the time history you see; the others are summaries.
Read the IDA curves
Open Results › OpenSees › Seismic charts › Incremental dynamic analysis. It plots peak storey drift against Sa(T1) for every run, and gives the number of runs and of runs that collapsed.
Read the collapse fragility
When two or more records collapse, the Collapse fragility chart fits a lognormal curve to their collapse intensities. It gives the Median collapse capacity as Sa(T1), the Dispersion β and the number of records used.
Read the fit with care
Records that never collapsed are left out, so the fit is optimistic unless the scale factors reach collapse for every record. When every record first collapses at the same level, the dispersion is unknown and a step is drawn.
What you learned
- Analysis › Incremental dynamic analysis (IDA) copies the time history and runs it at rising intensity.
- Intensity can be a scale factor or Sa(T1) of each record.
- Collapse is a storey drift past the limit or a run that stops converging.
- The fragility fit needs several records that reach collapse.